This past week was the start of the big tech companies reporting earnings. Microsoft, Texas Instruments, and Tesla were just a few that reported. Microsoft, guided downward, Tesla reported a great year and M2 Money Supply came in with bad news about consumers and the amount of money they have in their money market, savings and checking accounts. And yet markets rallied, as if Microsoft had reported blowout earnings along with Tesla as if they could do no wrong and that everybody in the United States was flush with enormous amounts of cash.
It is bewildering to me how markets have become more and more traded than invested in. This week was an example of that. This coming week will be a Apple Amazon, and a handful of other big names, that will influence or maybe not, the direction of the markets.
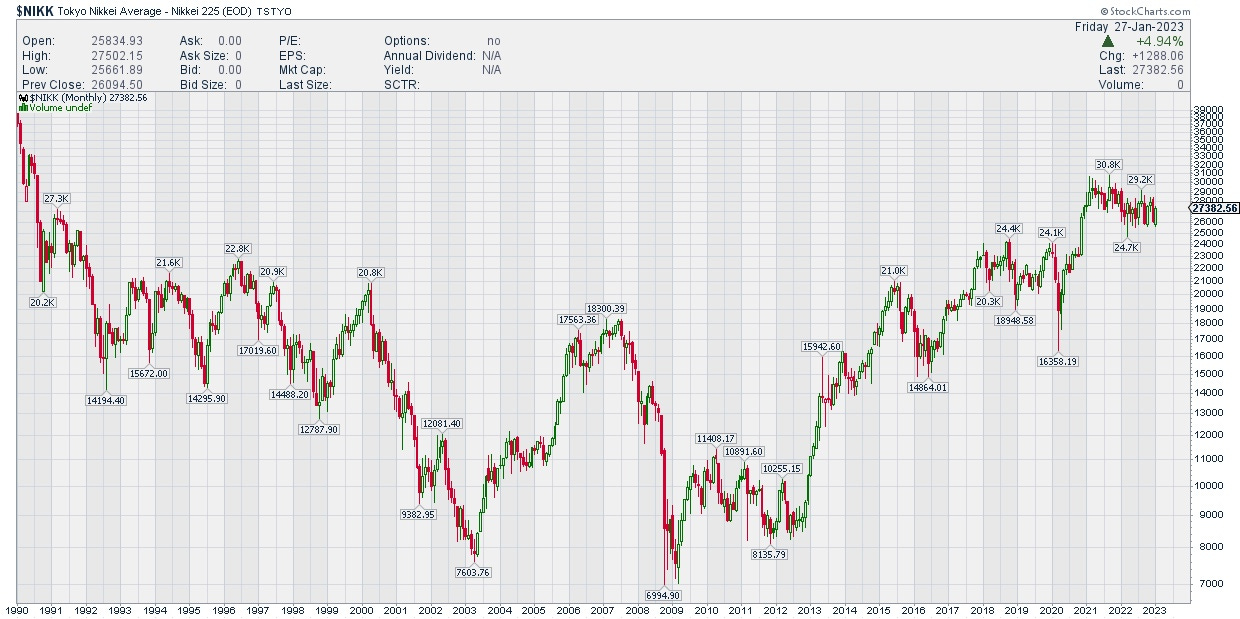
Jason Shapiro of the Crowded Market Report posted a tweet comparing the Nikkei in 1989 to 1990 and it’s rebound into 1991 to the NASDAQ from 2021 to today. That rebound in the Nikkei ended up meaning nothing in terms of today. His point of his tweet was that we are head towards the same economic situation as Japan was in the 1980s and early 90s.
Are we on the same path as Japan?
If so, then how will investors, traders play such a market?
30% plus of assets invested are in index funds and the number continues to grow due to their popularity in retirement accounts. If US index’s performance similar to the Nikkei Index for the next 30 years, investors could be in a world of hurt.
If the US is on the same economic path, what is moving markets and what indicators should we watch?
Over the last number of weeks I’ve been been writing a lot about Zero Days to Expiration Options and their effects on equity’s, in particular the SPY ETF.
The question I’ve been asking myself is if the US economy is going to perform similar to Japans economy over the coming years and with the growing popularity of Option trading, what indicators should I be using to give me / us better insight into market direction?
One such indicator I’ve referenced over the year and am referring to more and more is the Put/Call Ratio. Put / Call Ratio uses the volume of each option and creates a ration the indicates a Bearish or Bullish sentiment. The way it is calculated is by taking the Put Volume and dividing it by the Call Volume.
Example: Fridays Close of QQQ options.
Put Volume Total: 1,815,433
Call Volume Total: 1,630,406
Put/Call Volume Ratio: 1.11
If the ratio is 1, then it’s a neutral view.
If the ratio is >1, then it’s a Bearish view.
If the ratio is <0.7, then you have a Bullish view.
There are two ways you can look at this ratio. One, Fridays Put/Call Ratio was 1.11 on the QQQ ETF. There is more bearish point of view amongst traders. Or if you believe traders are majority of the time wrong about market direction, then the 1.11 Put/Call Ratio would tell us that we should be more bullish.
So which one is it? This is where you bring in other indicators such as Volume, Volatility, Price, Short-term, Intermediate-term and Long-term trends.
Here is what I think is coming in the week ahead.
Keep reading with a 7-day free trial
Subscribe to The Twelve to keep reading this post and get 7 days of free access to the full post archives.


