Is this past week a pivot week?
The last two days of this week saw more Put Option buying over Call buying in the QQQ’s. With the popularity of Zero Days to Expiration options, more short-term pressure has been put on Market Makers to hedge the option buys and sells causing stocks and index’s to move higher or lower.
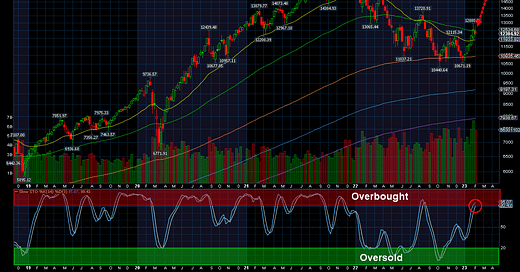
NDX, Nasdaq 100 Index
The chart above is the weekly chart of the Nasdaq 100 for the week of February 6th thru the 10th. I use the EMA indicator instead of the SMA indicator because it takes in news data vs an average of data. I’ve written (CHAT GPT3 actually wrote it) explanation of the difference between the two below.
Bullish % Index has dropped since last week to 52% of the Nasdaq 100 stocks being bullish vs the previous weeks 74%. This is a Rate of Change (ROC) of 29% . That is a number that makes me sit up and take notice.
Slow Stochastics indicator closed the week at 85.07% above the 70% overbought threshold. A drop below 70% will be an indication to sell or reduce the size of a position or begin to build a short position.
Conclusion
The three indicators that I’ve use above are signaling that the buying is tiring and the short sellers are taking notice.
Tesla
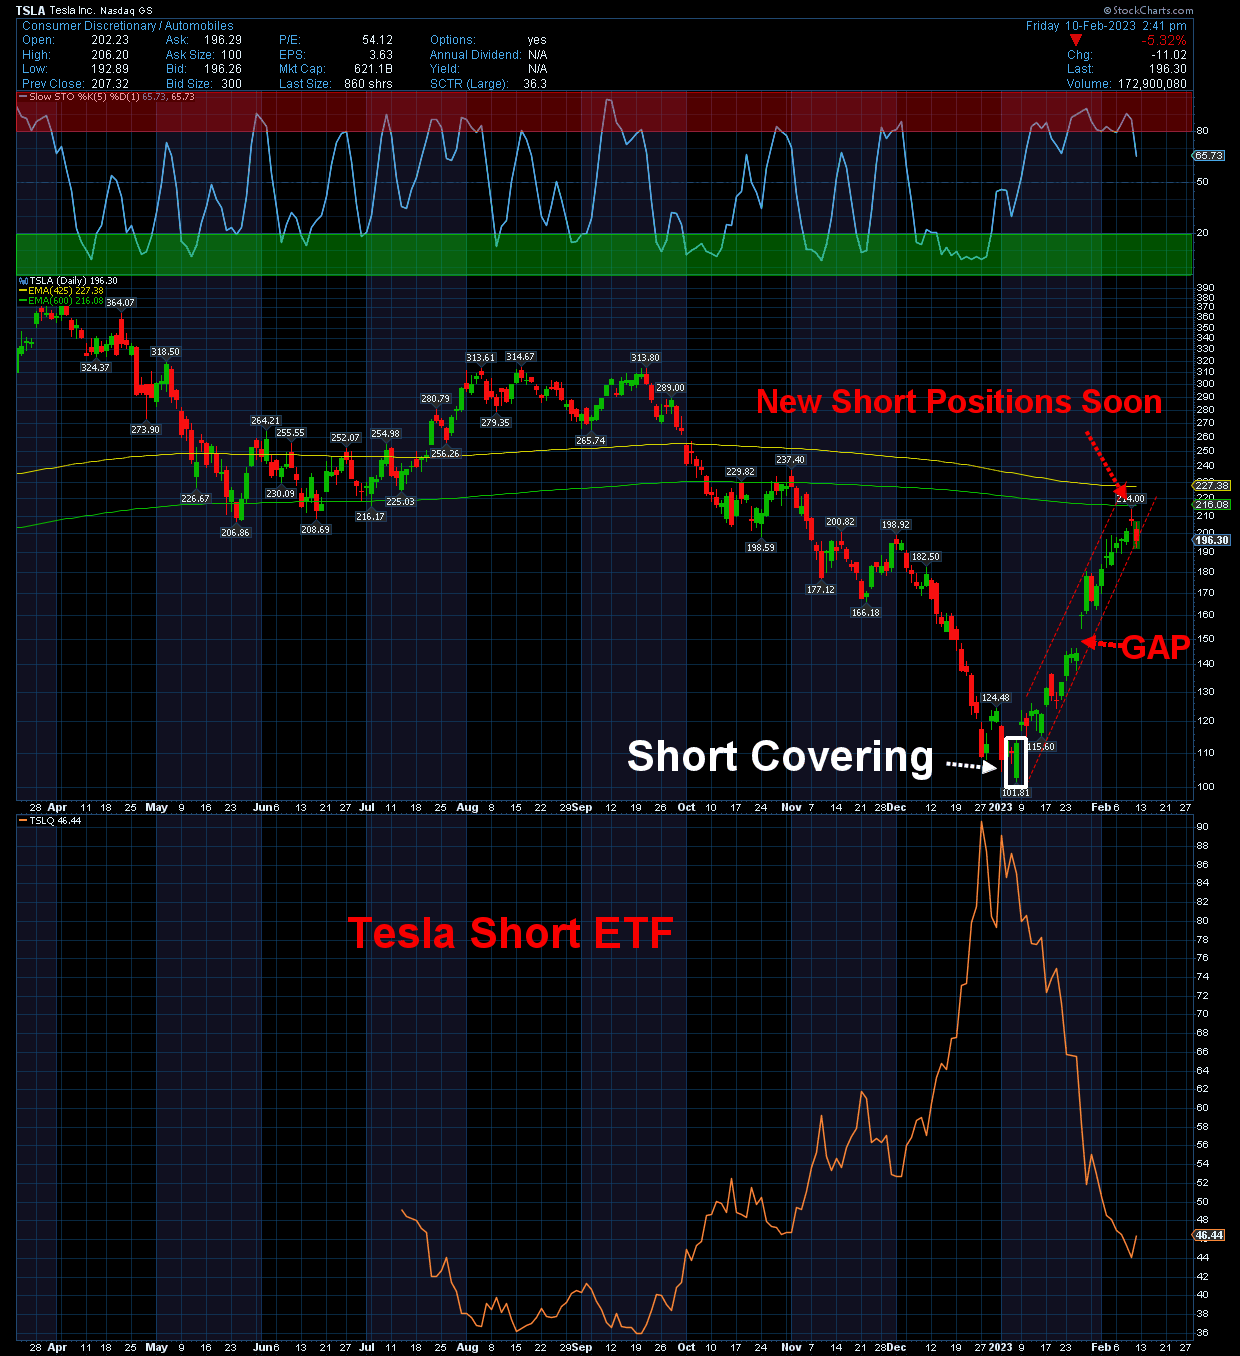
Bullish % Index has dropped since last week to 52% of the Nasdaq 100 stocks being bullish vs the previous weeks 74%. TSLA represents 3.91% of the QQQ ETF. Microsoft and Apple being the largest two stocks in the QQQ’s at 24% plus, Tesla is still a big influence on the direction of the Nasdaq 100.
Slow Stochastics indicator closed the week at 89.98% above the 70% overbought threshold. A drop below 70% will be an indication to sell or reduce the size of a position or begin to build a short position.
Tesla Daily Chart
On a daily chart you can see the gap between $140 and $160. This is a short term targe that typically will be filled and could be another point to see a bear market rally back to its high.
Conclusion
Tesla, like the QQQ’s is experiencing tiring buyers. The gap between $140 -$160 could be the target on the downside. I am considering using the leverage short ETF to capitalize on that $140 - $160 gap.
Knowledge: Difference between Exponential Moving Average and Simple Moving Average
By Chat GPT3
Exponential Moving Average (EMA) and Simple Moving Average (SMA) are two commonly used technical indicators in stock trading and financial analysis. Both are used to smooth out fluctuations in data and to help identify trends.
The main difference between EMA and SMA is the way they calculate the average.
A Simple Moving Average is calculated by summing up the last "n" periods (days, weeks, months, etc.) of data and then dividing the total by "n". For example, if you want to calculate a 10-day SMA, you would add up the closing prices of the last 10 days and divide the sum by 10.
On the other hand, an Exponential Moving Average gives more weight to the recent data and less weight to the older data. The formula for calculating an EMA takes into account the current price and the previous EMA value. The EMA is more responsive to recent price changes compared to the SMA.
In summary, an SMA gives equal weight to all the data points in the sample, while an EMA gives more weight to the most recent data points. The choice between using an SMA or EMA depends on the specific use case and the intended outcome.
Have a Great Week!
Live Loud!
Trent
Disclaimer
The above is not a recommendation nor advise. The opinions expressed are though of Trent Grinkmeyer and do not represent those affiliated with Best of US Investors. Trade at your own risk.


Mr. Grunch,
Thank you for subscribing. I having a difficultly figuring out how to do a partial reimbursement. I just wanted to let you know that I am working on it.
Sorry for the inconvenience.
Live Loud!
Trent
Trent: I'm Russ Grunch and subscribed to your QQQ service. Just got billed today (12 Feb 23) for $19.99 vice the new rate. Appreciate adjustment for the new rate.
Russ