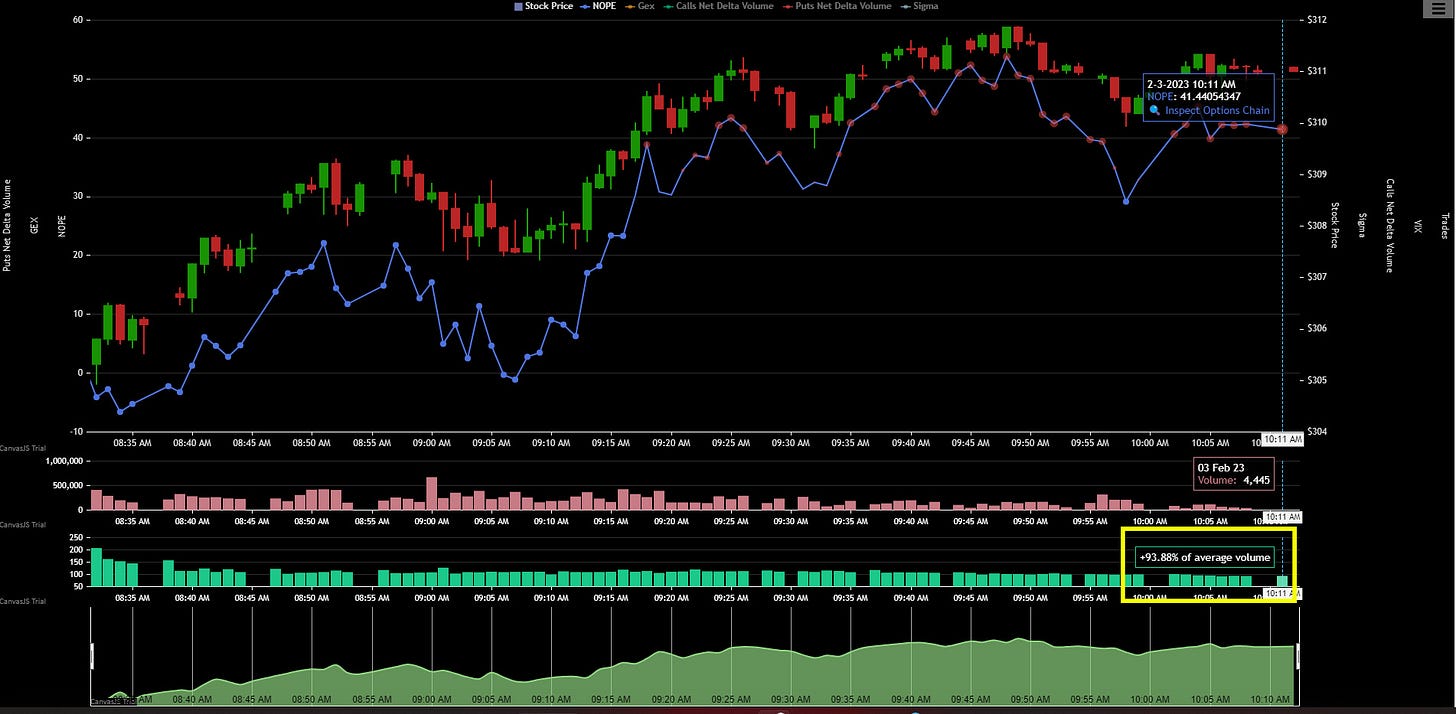
Yesterday I mentioned about the NOPECHART.com website that tracks daily Market Maker Option activity. Below is a chart and explanation of the minute by minute volume compared to the 60 day average for. At the time of this screen shot, volume was up 93.88% on average (see the yellow box). That is insane!
NOPE CHARTS explanation of the volume average:
This chart, located below the volume chart, is a trailing measure of the relative average volume traded. This is useful for determining whether the ticker is seeing a lot of activity throughout the day. The values are expressed in percentages relative to how much volume has been traded up to that minute, compared to the last 60 trailing days up to that same minute. For example, a value of +25% at 10:30am means that there have been +25% more volume traded compared to what is usually traded for this ticker in the last 60 days (higher relative volume) at 10:30am. A value of -25% would mean that 25% less shares have been traded up to that point (low relative volume).
Live Loud!
Trent
Disclaimer:
This Best of US Investors newsletter is not and should not be considered investment advice. This Best of US Investors newsletter is for informational purposes only. Nothing on this Best of US Investors newsletter constitutes a recommendation to buy, sell or hold any security at any time. Always consult with a financial professional that is familiar with your specific situation before making any investment or trade.
Use of this Best of US Investors newsletter is at your own risk. I make no warranties about the accuracy, completeness or reliability of any content on this Best of US Investors newsletter.
All the information on this Best of US Investors newsletter is provided “AS IS”.
Do not rely on any statements made on this Best of US Investors newsletter.
In no event shall Trent Grinkmeyer or any company affiliated with Trent Grinkmeyer be responsible or liable for any damage that occurs while using or reading any content on this Best of US Investors newsletter.
I may have a position (long, short or neutral) in any security mentioned on this Best of US Investors newsletter and therefore may realize significant gains in the event that the price of the security mentioned on this Best of US Investors newsletter declines or appreciates.
I may buy and/or sell any security mentioned on this twitter account at any time and for any reason. I may trade contrary or different to the information provided on this Best of US Investors newsletter. You should assume that any email or post on this Best of US Investors newsletter may cause the price of the security mentioned to appreciate or decline in a dramatic way.
I may continue to transact in any security mentioned on this Best of US Investors newsletter an indefinite period of time after any email or post and such positions may be long, short or neutral at any time hereafter regardless of the initial view or positions stated on this Best of US Investors newsletter.
In no event shall Trent Grinkmeyer or any company affiliated with Trent Grinkmeyer be liable for any claims, losses, costs or damages of any kind including direct, indirect, punitive, exemplary, incidental, special or consequential damages, arising out of or in any way connected with any information presented on this Best of US Investors newsletter This limitation of liability applies regardless of any negligence or gross negligence of Trent Grinkmeyer or any company affiliated with Trent Grinkmeyer. You accept all risks in relying on the information presented on this Best of US Investors newsletter.
If any statement in this legal disclaimer is held to be invalid or unenforceable, then the remaining provisions shall continue in full force and effect.


