Not Even With A 10ft Poll
Voodoo in the air
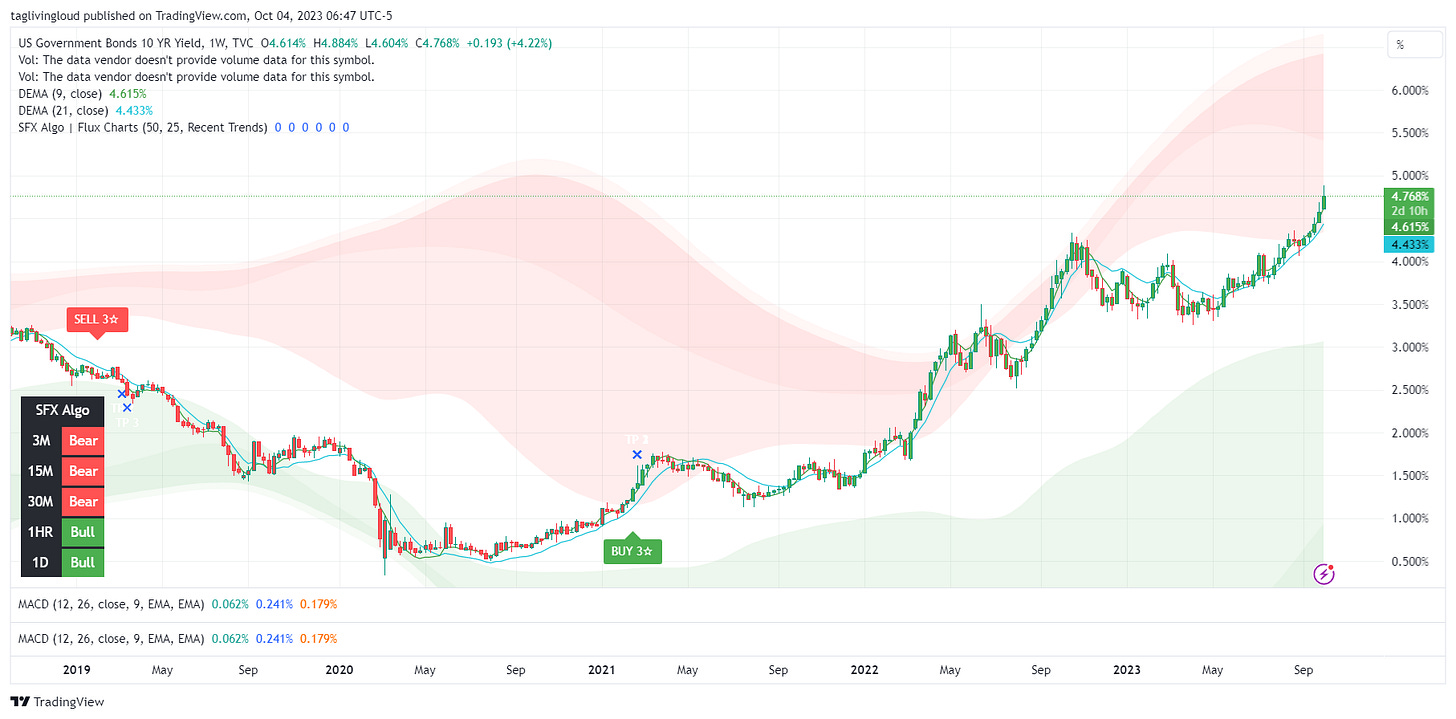
Nope! Nothing looks attractive at this point especially the Magnificent 7. On Monday 111 stocks were up of the 500 in the S&P 500. The remaining stocks where down on an average -1.72%. This should’ve been an indicator to many that Tuesdays jump in the VIX over 20 and the selloff in the S&P, DOW (now negative YTD) along with the NASDAQ. The US 10 year treasury yield is now at 4.82% above 2007 highs. Many are saying this is similar to 1987 and 2018.
DJIA Daily Chart YTD
US 10yr Treasury Weekly 5yr Chart
The name of this game is to keep what you made. With many stocks, trending south, there is no reason to get caught up in the Hope Trade.
Subscribe for $13 month and receive:
QQQTRADES Stock Idea List
QQQTRADES Dividend Stock/Covered Call Ideas
QQQTRADES Intermediate Term ETF Buy/Hold/Sell List
Keep reading with a 7-day free trial
Subscribe to The Twelve to keep reading this post and get 7 days of free access to the full post archives.


